
Javascript development for the web is much improved with the F12 dev tools built-in to modern browsers. While it is possible to use these tools for plethora reasons, my current favourite feature is the console log.
To access the dev tools press F12 and open the dev tools window, then click on the console tab. I also recommend popping dev tools out to a new window and placing it in an adjacent monitor. Click to the right of the > then add write the code below in to the console REPL (read, evaluate, print loop):
console.log(x);
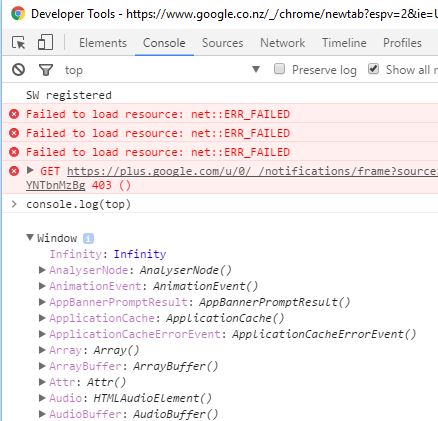
‘x’ can be anything you like, a number (my favourite), a function, an object or a string. See the screenshot below from Chrome’s dev tools at Google’s homepage. Note I’ve evaluated top, which is a javascript alias for the current window in the browser.
Dev tools are great to evaluate the content on you favourite websites, and best of all try out some of the features built in to the browser using javascript.